Ear2Earth - Lead Developer
An open source web-based enviromental sensor sonification platform that turns raw IoT data into real-time visualization and sonification
The problem
Environmental sensor networks produce constant streams of raw data: temperature, humidity, water levels. Almost every tool built to explore that data assumes the viewer already thinks like a data scientist. Dashboards and line charts work fine for people trained to read them. They don't work as well for the community members, students, and general public who actually show up at an outreach event, a youth workshop, or a public science fair. Those are often the same people most affected by what the sensor data is measuring in the first place.
My approach
Rather than build another dashboard, Ear2Earth borrows an interface a lot of non-technical people already know how to use: the Digital Audio Workstation. Anyone who has opened Audacity or GarageBand already understands most of it. Data becomes a track. Time still runs left to right. Exploring a dataset means playing, scrubbing, and listening, the same way you'd edit a song.
That bet came from a set of values I treated as real constraints, not just good intentions: accessibility to non-technical audiences first, familiarity over novelty in every interface decision, and, architecturally, coordinated rather than parallel sonification and visualization. Sound and visuals stay locked to the same timeline instead of living as two separate features that happen to sync up.
// Simplified version of the playback sync pattern.
// Sonification and visualization both derive from one shared clock.
audioEngine.on('timeupdate', (currentTime) => {
  const dataPoint = dataset.sampleAt(currentTime);
  waveformView.highlight(currentTime);
  chartView.setCursor(dataPoint);
});
Key decisions
The DAW-over-dashboard framing was the biggest architectural commitment, and it wasn't free. A waveform-and-track metaphor reads as less immediately scientific than a chart, at least to someone already fluent in data tools. I judged that tradeoff worth making because of who the tool was actually built for. At a youth environmental workshop or a marine science open house, a five-second learning curve matters more than looking like conventional scientific software.
The other constraint I held firm on was coordinating sonification and visualization instead of letting them drift into two independently toggleable features. That meant more upfront architecture work, since every playback state has to stay valid for both the ear and the eye at once. But it kept the tool from splitting into an audio version and a chart version that just happened to share a codebase.
Outcome
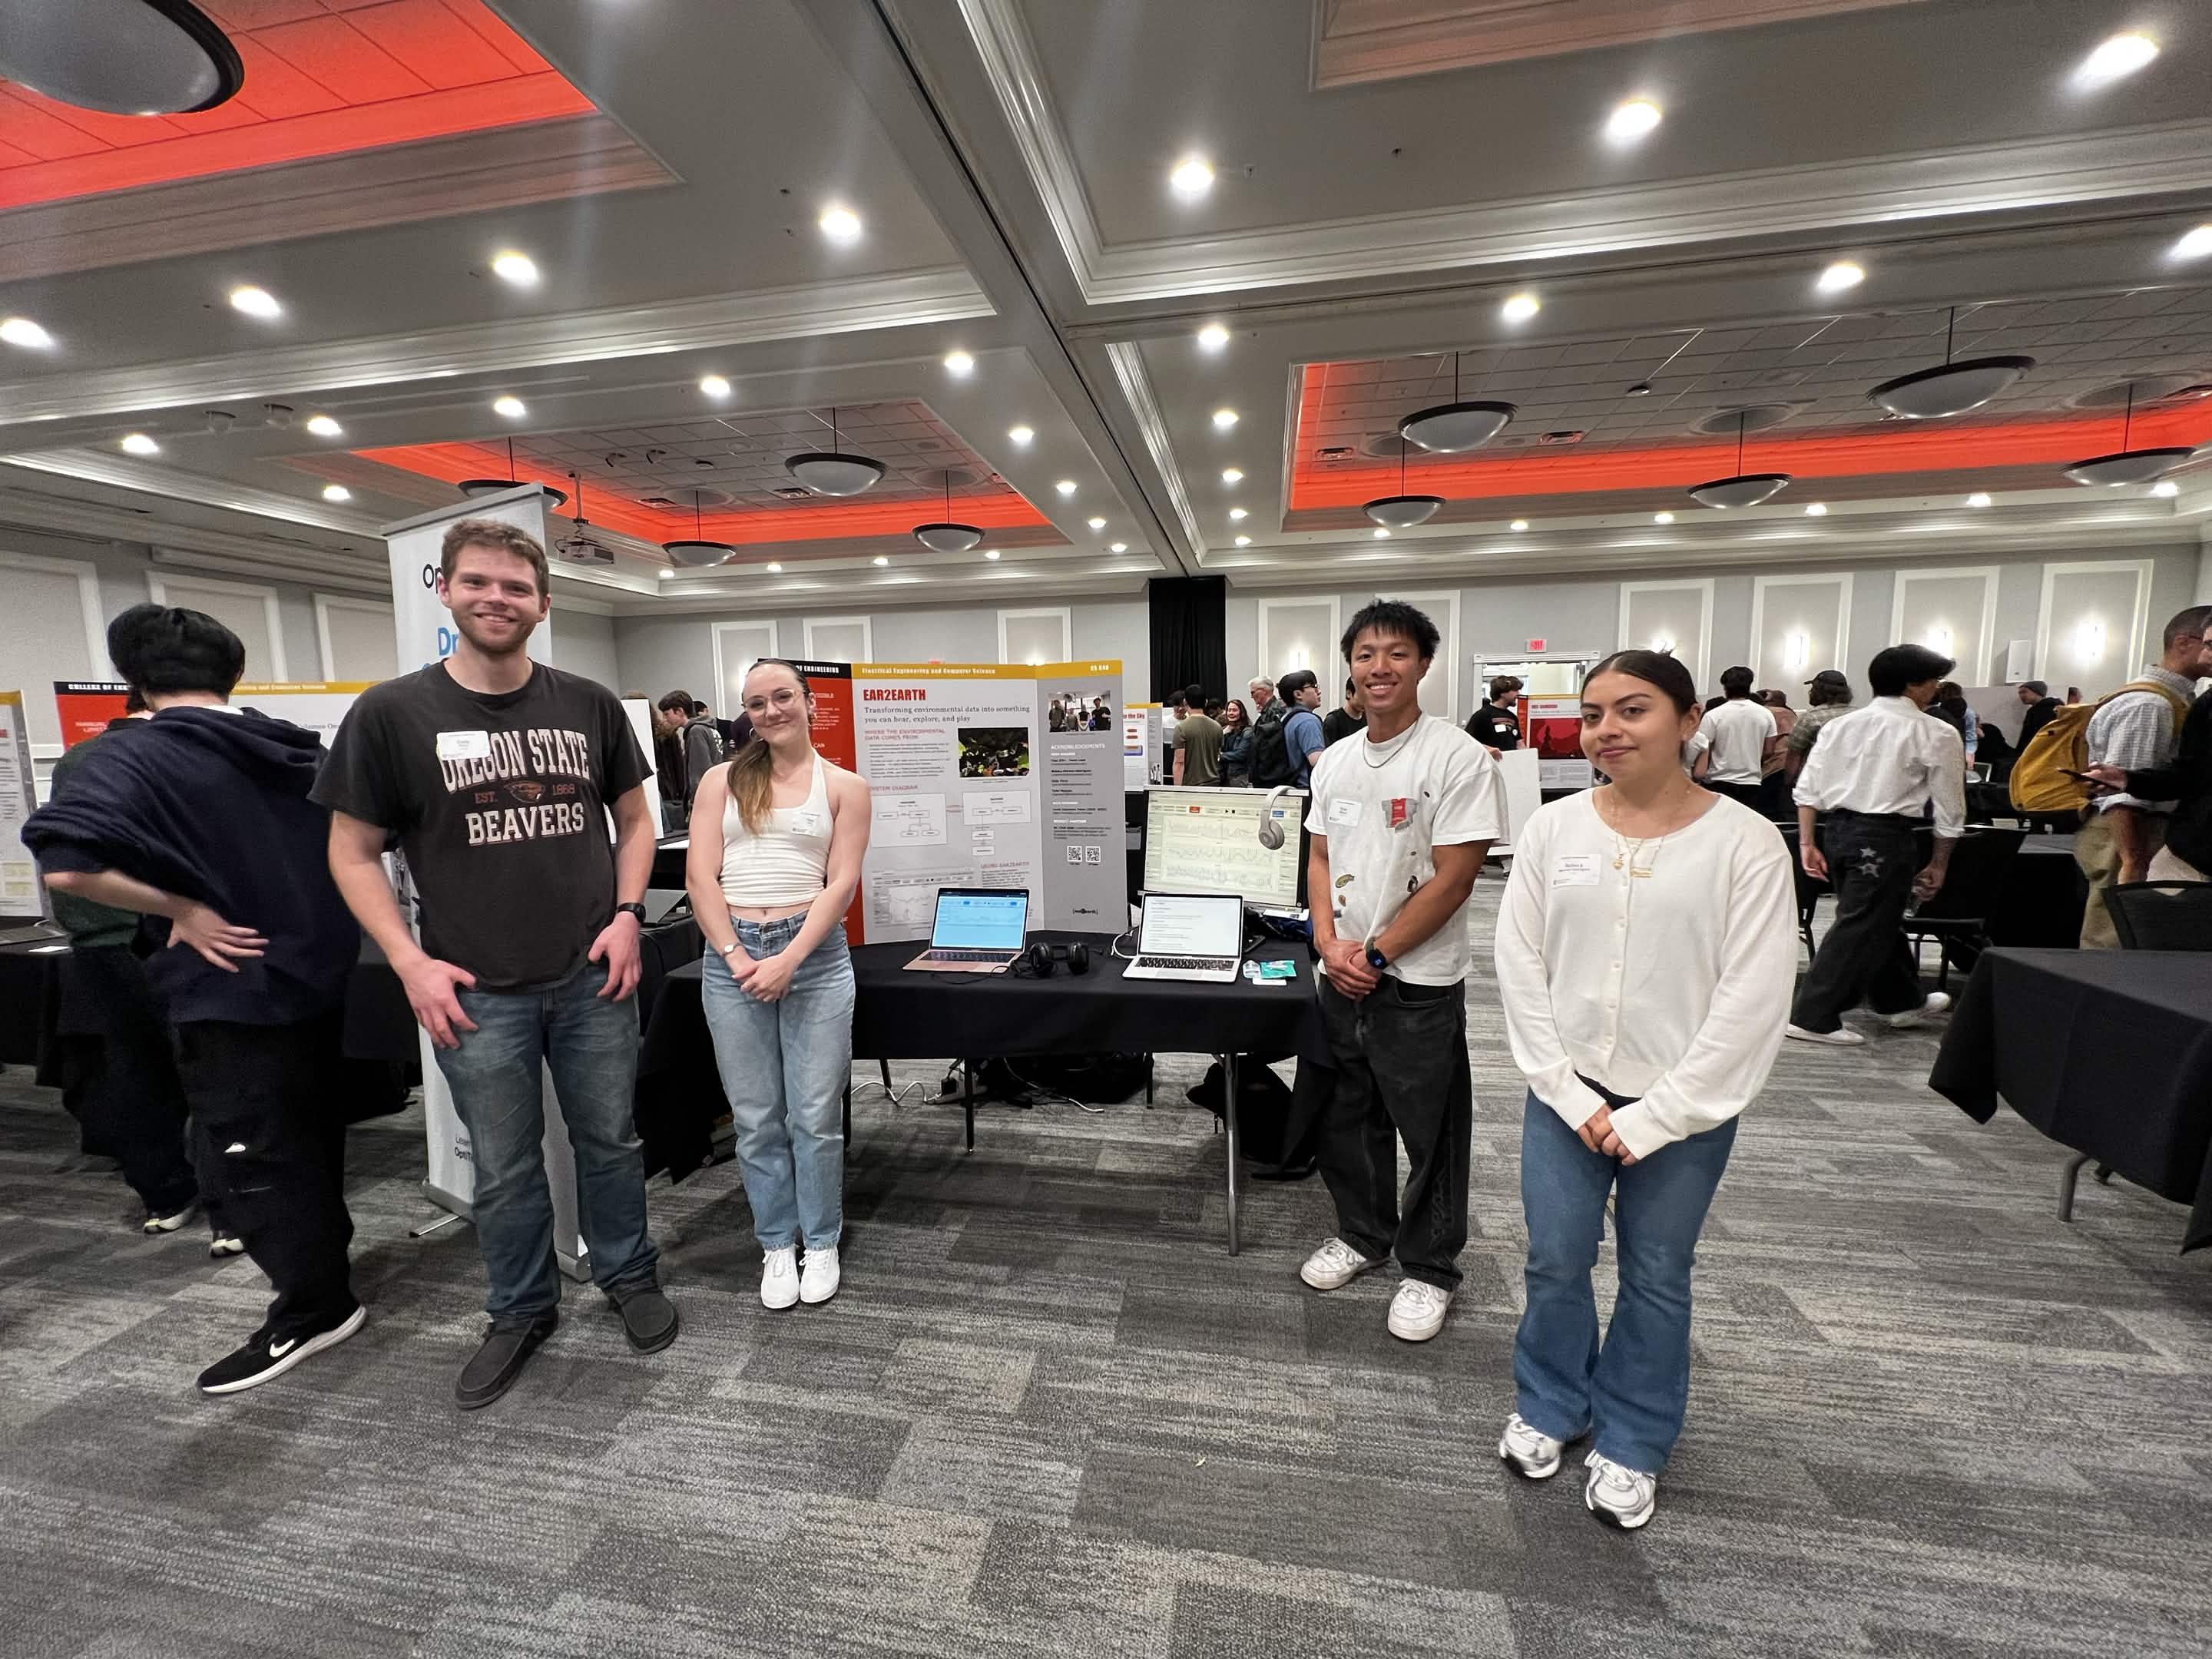
The thesis was accepted at defense with no revisions required. More importantly, Ear2Earth got tested outside the lab, repeatedly, at venues from the AGU 2025 Sensors Workshop and Expo Center to the Alaska Youth Stewards Environmental Sensors Workshop in Hoonah.
Watching visitors with zero technical background pick it up and immediately understand what they were hearing was the clearest sign the accessibility bet had paid off.
What's next: visual affordances and iconography that make the interface more legible at a glance, richer visual feedback during playback, adaptive sonification that responds to the shape of the dataset instead of a fixed mapping, and a mobile-friendly redesign so the tool isn't tied to a desk.